When designing complex systems, understanding the relationships between design decisions and design criteria is very important. Current visualization tools such as scatter plots or parallel axis plots are good for visualizing either the decision space or the objective space in a few dimensions. However, they are not very good at conveying information about the mapping between the decision space and the objective space. One can alleviate these limitations somewhat by linking multiple plots together so that they are all updated simultaneously. But extracting useful information from such linked plots still requires significant cognitive effort from the designer, especially in the presence of many objectives and complex combinatorial decisions — which is typical for system architecture.
To address this problem, our lab developed a new visualization method called Cityplot that is designed to provide a quick, intuitive view of the “design landscape”. Cityplot simultaneously shows the information from the decision space (position of designs or cities in a 2d plane) and from the objective space (number and height of the buildings in a city)
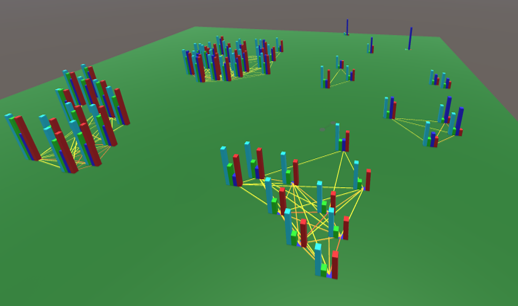
Cityplot uses an unsupervised machine learning technique called multidimensional scaling to reduce the information from the design decisions into two dimensions. More specifically, the positions of the designs in the 2d plane are calculated to minimize the average distortion of the distances between pairs of designs. This requires the definition of a design distance function, which is problem-specific but can be as simple as Euclidean distance (continuous decisions) or Hamming distance (binary decisions). Once the positions of the designs (citiers) are calculated, the information about the objectives for a design is visualized by means of a bar plot. One bar (building) is drawn per objective , and the height of the building is proportional to the value of the objective. Thus, cities are groups of buildings. Finally, in a Cityplot there are also roads, which connect nearby cities (similar designs) and use color-coding to indicate the original distances between pairwise designs (which may be distorted by the multidimensional scaling algorithm).
Combined, these two visualizations provide a simple and intuitive way of seeing the design space (decisions and objectives) at a glance, identifying design families (groups of similar designs) and evaluating sensitivities (gradients or slopes).
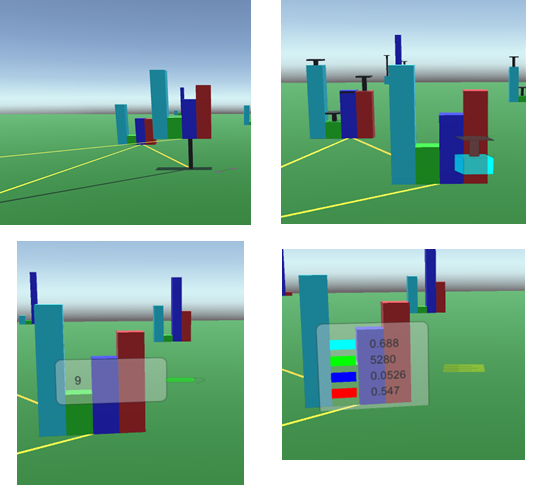
To make the most of this new methodology, we developed a virtual reality tool (Cityplot-VR), which allows the user to immerse themselves in the design space and obtain additional information by interacting with the plot using various tools (e.g., zooming in and out, identifying cities connected to a given city or road, etc). Some of these tools are shown below.
It would have been easy for us to stop here and claim that our tool is useful. However, we take research validation very seriously, so we went ahead and conducted a study with human subjects to test various hypothesis concerning the ability of Cityplot to increase human performance in several design space exploration tasks, such as finding designs that meet certain requirements or changes thereof, identifying design families, or evaluating sensitivities, when compared to traditional tools. The results were very positive and showed that participants using Cityplot performed statistically significantly better than those using linked scatter plots and parallel axis plots in most tasks. Users also preferred Cityplot overall across several subjective dimensions such as engagement and ease of use.
Publications:
- [1] N. Knerr, N. Kinzly, and D. Selva, “Human Performance Study On A Virtual Reality Visualization System For Engineering Design Space Exploration,” Submitted to J. Mech. Des.
- [2] N. Knerr and D. Selva, “Cityplot: Visualization of High-Dimensional Design Spaces With Multiple Criteria,” J. Mech. Des., vol. 138, no. 9, p. 091403, 2016.